Hydraulic networks
The combined power of QGIS and PostGIS proves highly effective in addressing typical challenges associated with hydraulic network management.
As part of the Etra project, Faunalia developed a set of PostGIS-based hydraulic network control tools. This flexible solution allows the full use of these functionalities across platforms: QGIS on the desktop and Lizmap on the web.
Key functionalities of this solution include:
Network element topology
The solution involves applying consistency checks during the every modification of hydraulic network elements, such as valves, fittings, or pipelines. Database-level geometry validation ensures robust and secure network management, regardless of the user interface, whether desktop or web-based.
Key checks of this solution include:
- Automatic creation of network elements dependent on other elements
- Modification of network elements following changes to their dependent elements
- Prevention of element insertion or modification when specified conditions are not met
SINFI data processing
Database extraction of network element information, and automatic generation of shapefiles required by the National Federated Infrastructure Information System (SINFI).
Management of hydraulic disruptions
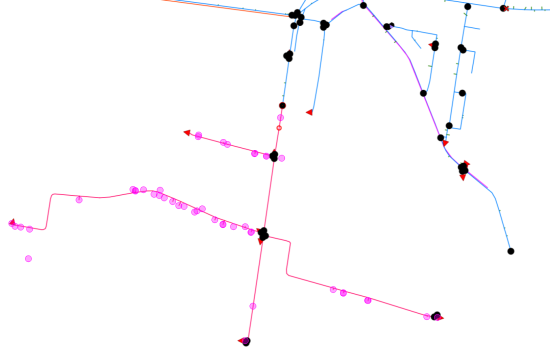
Accurate identification of elements affected by a hydraulic disruption event is critical to ensure efficient service for end users. The process of defining a hydraulic interruption is typically based on computational analyses, whose duration is directly proportional to both network complexity and the robustness of its definition (see Network element topology). Specifically, the calculation must identify the affected pipelines, the valves that need to be closed to isolate the impacted network section, and the users/connections impacted by the outage.
Using PostGIS significantly improves computational performance and, like the other solutions listed on this page, enables processing on both QGIS (desktop) and Lizmap (web) platforms.
Our solution implements:
- Calculation of affected elements based on a single pipeline section
- Calculation of affected elements based on the selection of multiple pipelines
- Ability to manually adjust processing results when calculations are based on outdated or pending-update network elements
- On-screen display and extraction of valves and users/connections affected by the outage
- PDF printing of the involved features
- Automated calculations for the required indicators
- Cross-platform support (QGIS and Lizmap)
Example using in Lizmap: Analyzing a network outage originating from one pipe segment:
